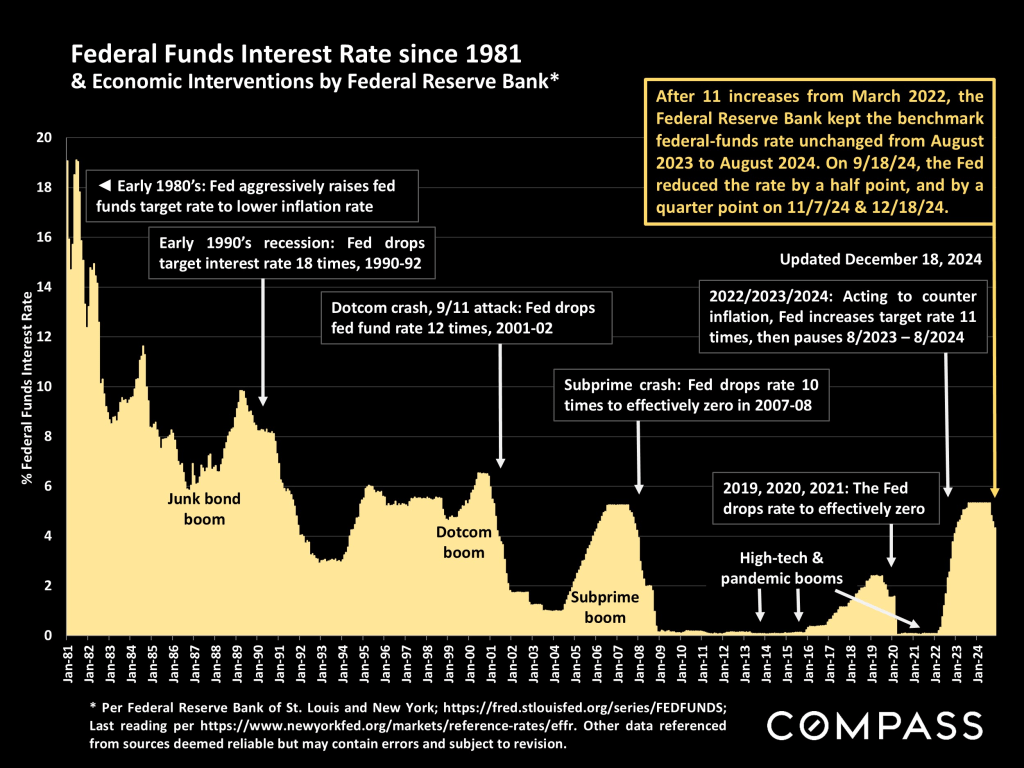
On December 18th, the Fed dropped its benchmark rate for the 3rd time since summer, by another quarter percent, but suggested only 2 further reductions in 2025 – which was not what investors and bond markets wanted to hear. This caused stock markets to fall from recent highs and mortgage interest rates to spike up, but, so far, these are very short-term reactions and may quickly change course again. In early December readings, the U.S. jobs report rebounded, inflation ticked up slightly, and consumer confidence hit its highest point in 7 months. And, as of the date of this report, a government shutdown looms once again due to the inability of Congress to agree on a spending bill.
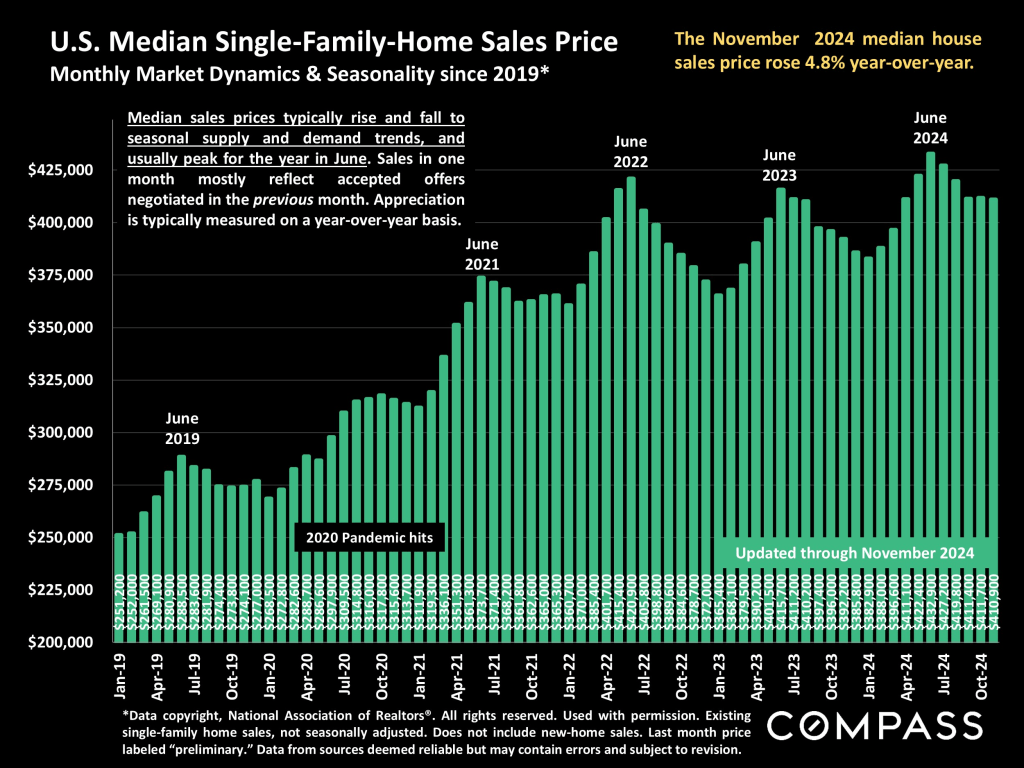
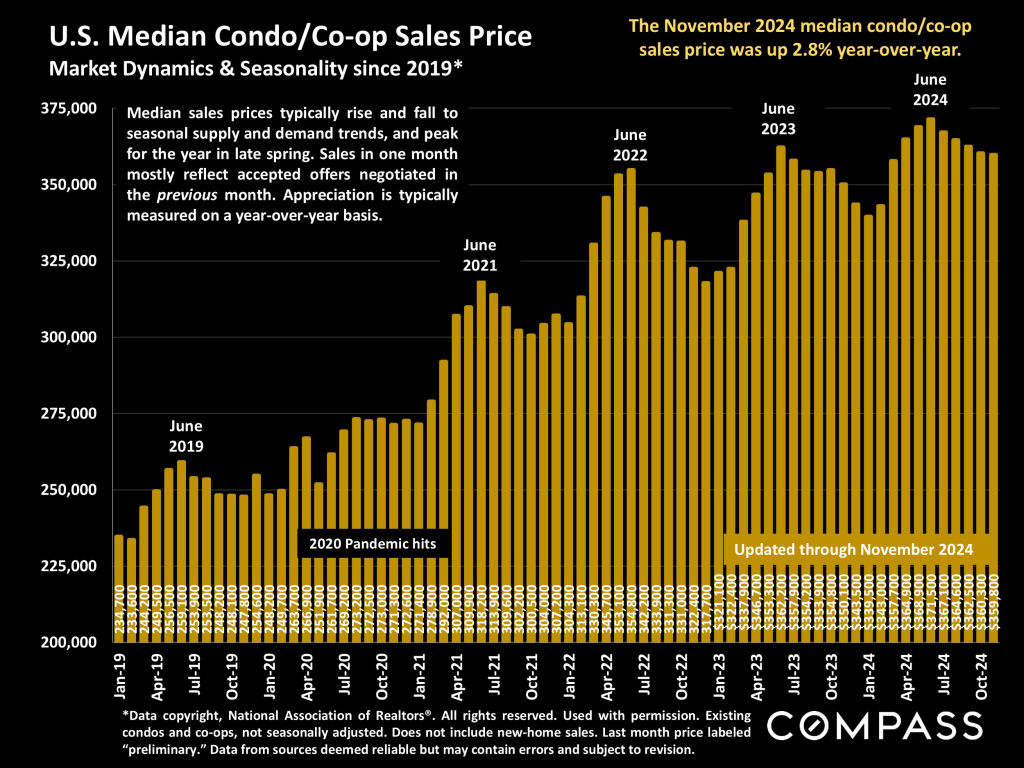
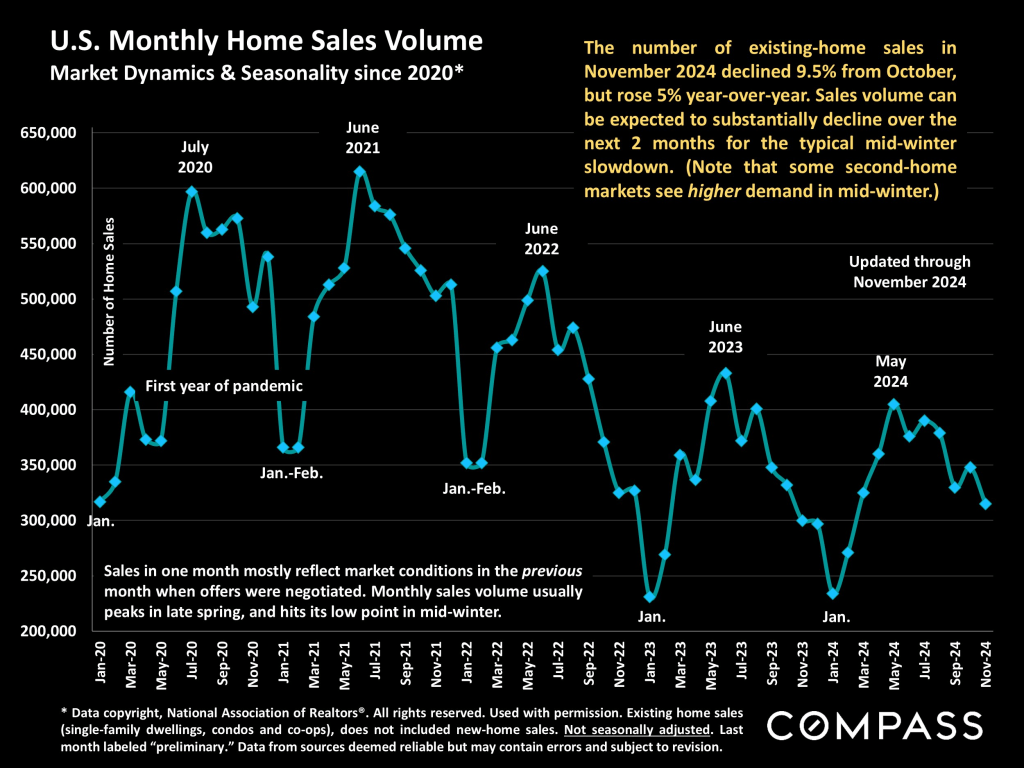
- National existing-home sales in November 2024 fell 9.5% from October but rose 5% from November 2023. Though continuing to fall from the usual June peaks, year over year, the median single-family-home sales price and median condo/co-op sales price were up 4.8% and 2.8% respectively.
- Moving into the mid-winter holiday slowdown, the numbers of new listings, homes for sale, listings pending sale and closed sales all declined, and can be expected to drop further in December.
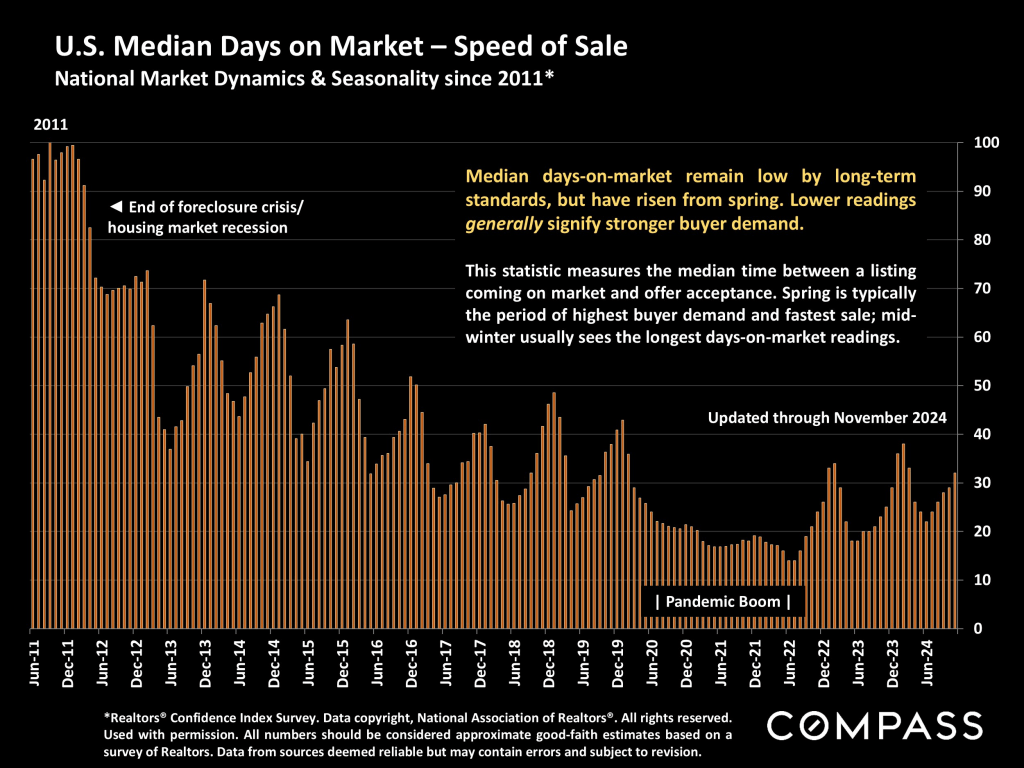
- Approximately 53% of sales went into contract in less than 1 month (vs. 62% in 11/23), 18% sold over list price, and 25% of buyers purchased all-cash. The median days-on-market to acceptance of offer was 32 days (vs. 25 days last year), and sold listings received an average of 2.1 offers. Approximately, 30% of purchases were by first-time buyers, and 4% by vacation home buyers.
It is difficult to make definitive determinations about where the market is heading in 2025 from end-of-year statistics, but in the last several years, demand rebounded substantially early in the new year and then accelerated into spring. As always, much depends on political and macroeconomic factors that are challenging to predict.
On 12/18/24, the Fed reduced its benchmark rate again, but, so far, the scale of its recent reductions and the Fed’s forecast for future actions have disappointed investors and bond markets, causing interest rates to increase.
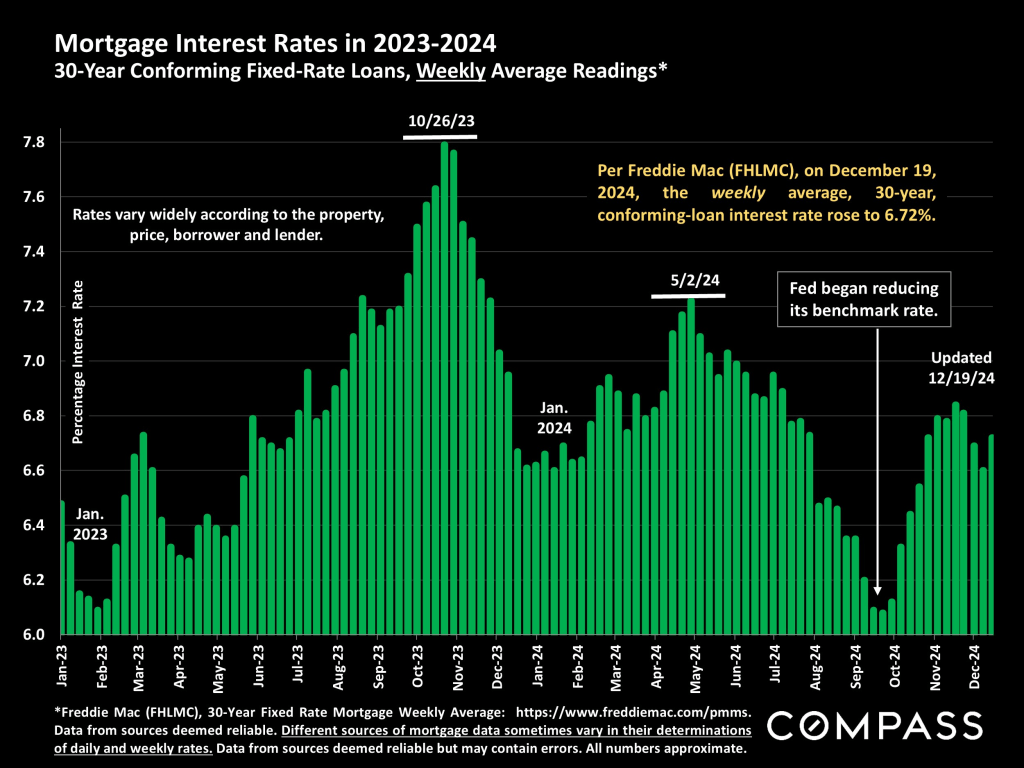
This weekly average interest rate chart understates the increase that occurred on the day of the latest Fed announcement. Over the past 3 years, predictions of interest rate changes have more often been wrong than right: Too many volatile factors at play. The hope is that rates will substantially decline in 2025 to motivate more buyers and sellers to jump back into the market.
Monthly median house sales prices since 2019. Seasonal ebbs and flows are the norm, with annual highs usually occurring in June, reflecting the supply and demand dynamics of late spring. The median house price continues to rise on a year-over-year basis.
Condos and co-ops make up a much smaller percentage of total home sales and tend to be concentrated in more expensive urban-area markets. Their median sales prices have also continued to increase year over year.
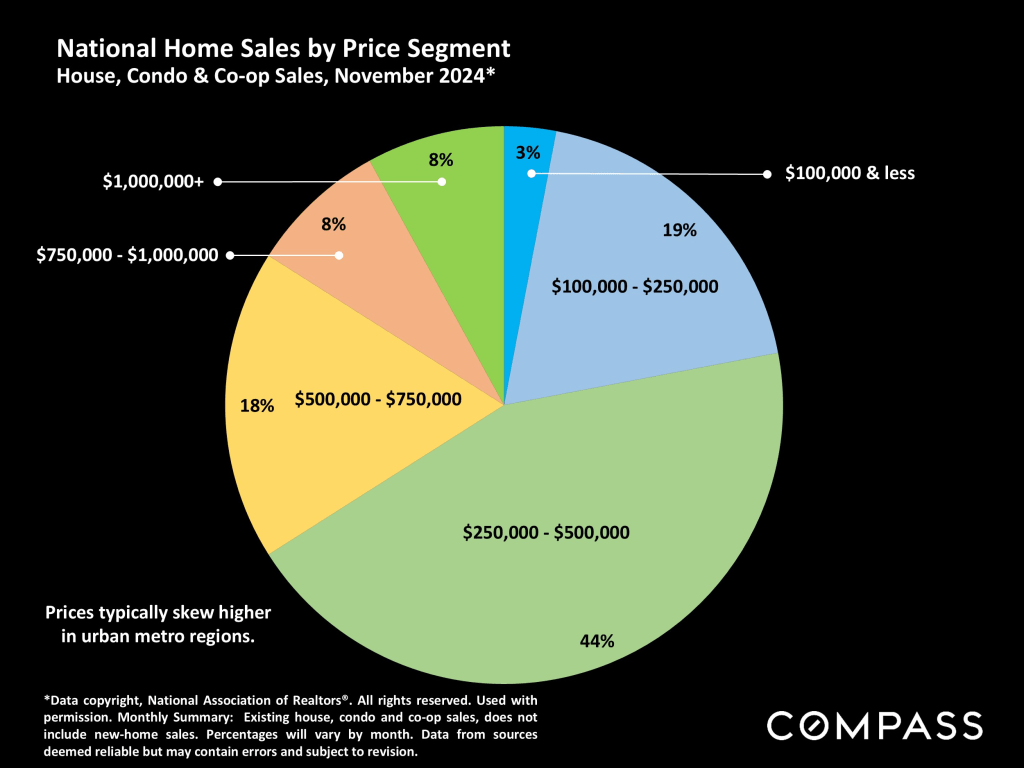
U.S. home sales by price segment, though, of course, there are many markets in which home prices skew much higher. Affordability is the most critical factor in housing today, leading to some large social, demographic and market shifts.
By virtually every metric, the national housing market downshifts much slower at the end of the year (though some big second-home and “snowbird” markets buck this trend). Generally speaking, listing and sales activity plummets, to pick up again in the new year. There is something about starting a new year that seems to motivate people to move forward with major life changes, such as relocating to a new place, a new job, a new home.
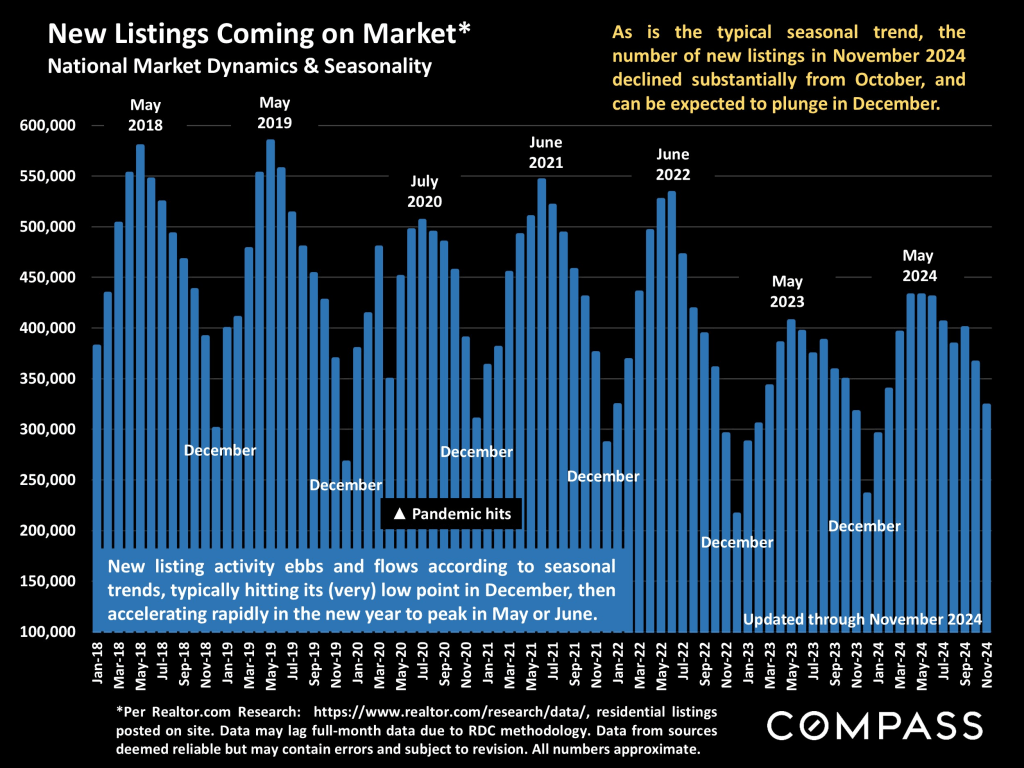
Since closed sales mostly reflect listings that went into contract in the previous month, the lowest sales volumes are typically seen in January (and sometimes February), because the slowest weeks of the market run from early December to early January. However, deals continue to be made in every week of the year.
As the number of new listings plunges, a greater percentage of sales are of homes that have been on the market for longer periods, which causes the median days-on-market reading to peak in mid-winter. These older listings are often the best opportunities for buyers to negotiate most aggressively.
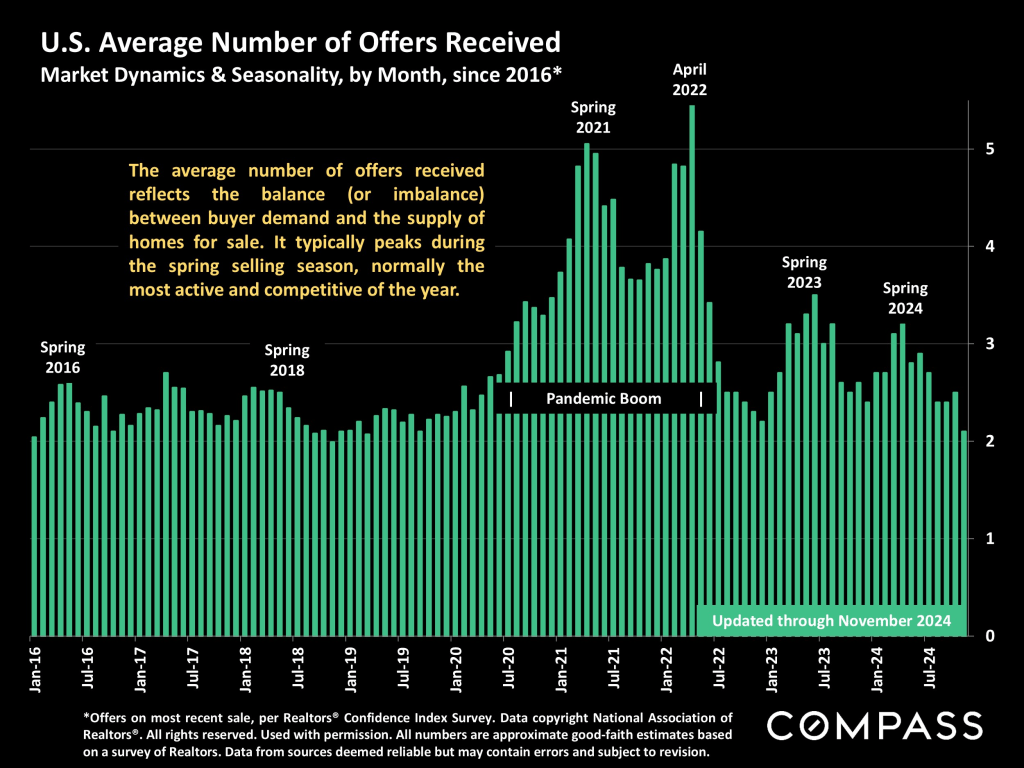
As demand falls, there is less competition for those homes on the market, which is why the average number of offers hits its low point in mid-winter. Less (or no) competition is a big advantage for buyers.
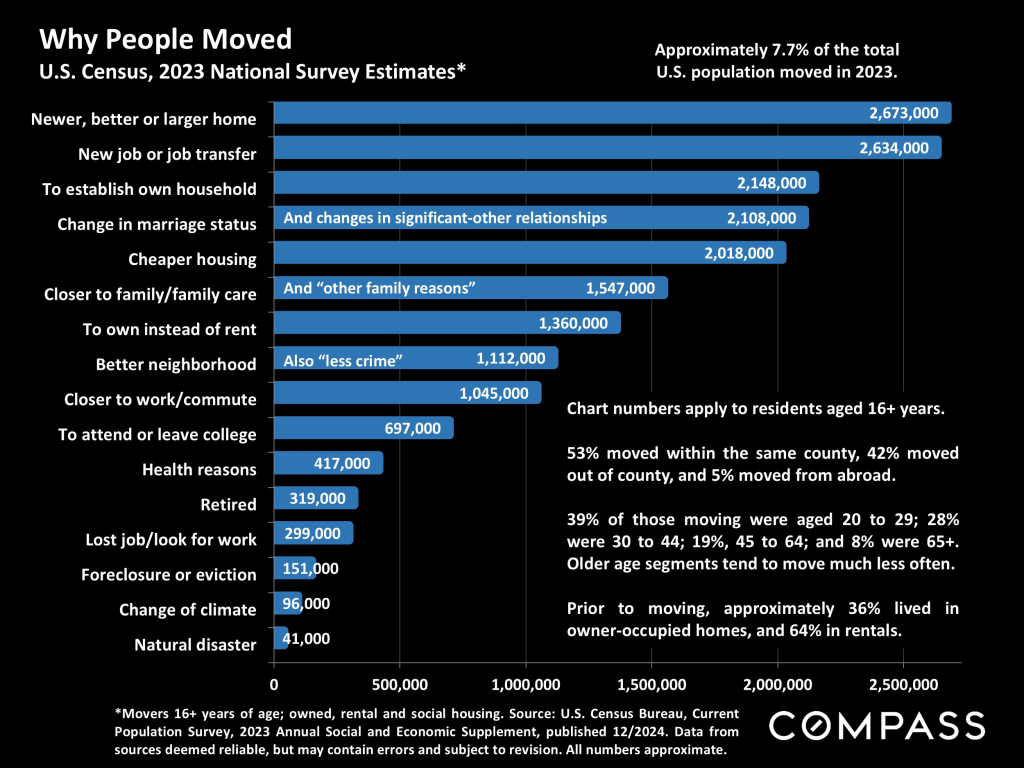
The U.S. Census just published several new data releases pertaining to housing. This chart below reviews why, where and who moved in 2023.
This Census graphic illustrates the most common home improvements and their median costs: The largest expenditures were for roofing, kitchen and bathroom remodels, and heating, ventilation and air conditioning (HVAC). 25% of homeowners made energy efficiency improvements.

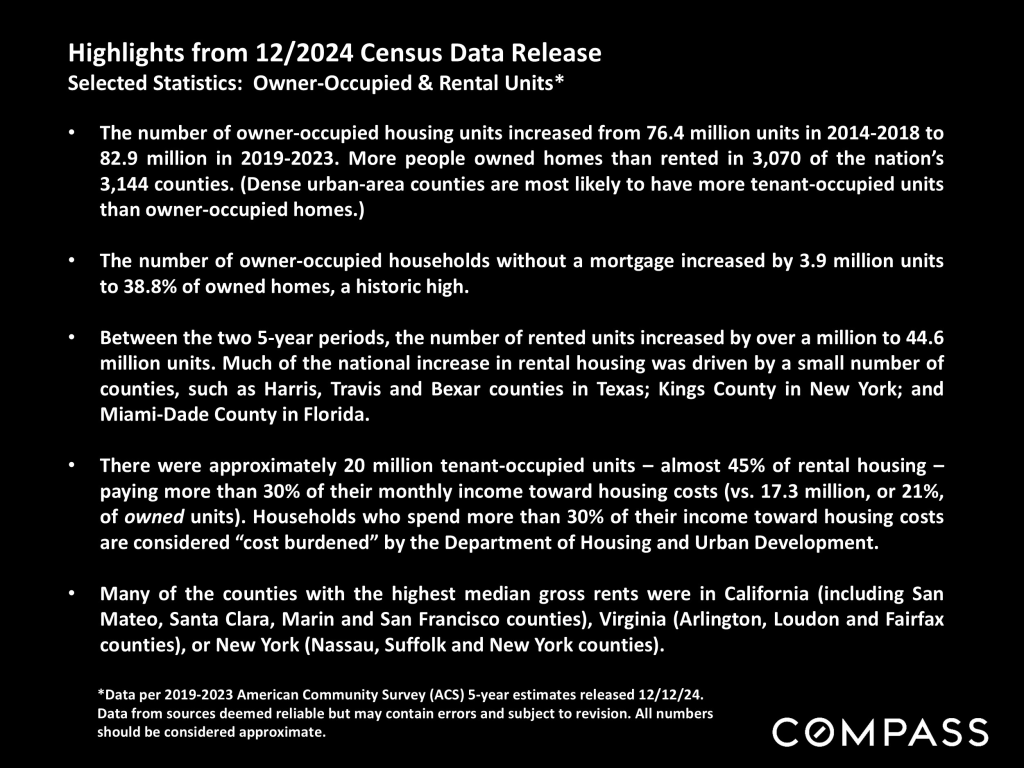
The latest homeownership and tenancy numbers and costs:
Final Thoughts
The national real estate market remains a complex and ever-changing landscape. As we close out 2024, the data tells a compelling story of resilience amidst challenges like fluctuating interest rates, affordability constraints, and shifting buyer behaviors. Key takeaways from this month’s insights highlight the importance of adaptability for both buyers and sellers. Whether it’s navigating slower market activity in winter or leveraging opportunities in less competitive conditions, there are strategic moves to be made.
Looking ahead, the hope for interest rate relief in 2025 could inject new momentum into the market, encouraging broader participation and potentially easing affordability pressures. For now, understanding the nuances of seasonal trends and demographic shifts will be crucial for staying ahead in the real estate game.
As we embark on a new year, let these insights inspire informed decision-making and a proactive approach to seizing opportunities in a market that rewards those who stay prepared.

Leave a comment